What reporting features are important in a ticketing system for tracking service quality?
Most ticketing systems produce charts. The real question is whether the reports show if customers got fast, reliable, correct help, and which ticket, agent or channel to fix when they didn't.
Research guide by Senso Research · Sources checked September 25, 2026
The quick answer: The reporting features that matter measure four things: speed (first response, follow-up and resolution times), reliability (whether each ticket met its service-level target), outcome (customer ratings, comments and reopened tickets) and workload (volume, backlog and missed chats or calls), each filterable by agent, team and channel. Our pick for a growing team that wants those measures across email, chat and phone in one per-agent plan is LiveAgent: from its Medium plan ($29 per agent per month billed annually), the performance report tracks answer, assignment and resolution times, and the SLA log records every due date and how early or late it was met. Freshdesk's curated reports go further on backlogs and reopens; Help Scout offers a simpler satisfaction score.
What to measure, and how
- Speed. Averages for first response, next response and resolution. LiveAgent's performance report tracks the average time from New to Answered, to first assignment and to first resolution, each with a variant counted only within the business hours of the ticket's SLA level. That keeps nights and weekends from inflating the numbers.
- Reliability. An average can look healthy while individual customers wait too long. Look for a per-ticket record: LiveAgent's SLA log lists each ticket's level, start time, due date, closing time and remaining or overdue time for first answer, next answer, first assignment and first resolution.
- Outcome. Ratings and comments show whether answers helped. Reopened tickets show whether problems stayed solved.
- Workload. Volume, backlog, missed chats and unanswered calls explain why speed or ratings changed.
What not to assume: that two tools calculate the same metric the same way. Check whether percentages include unrated conversations, and whether times use business hours.
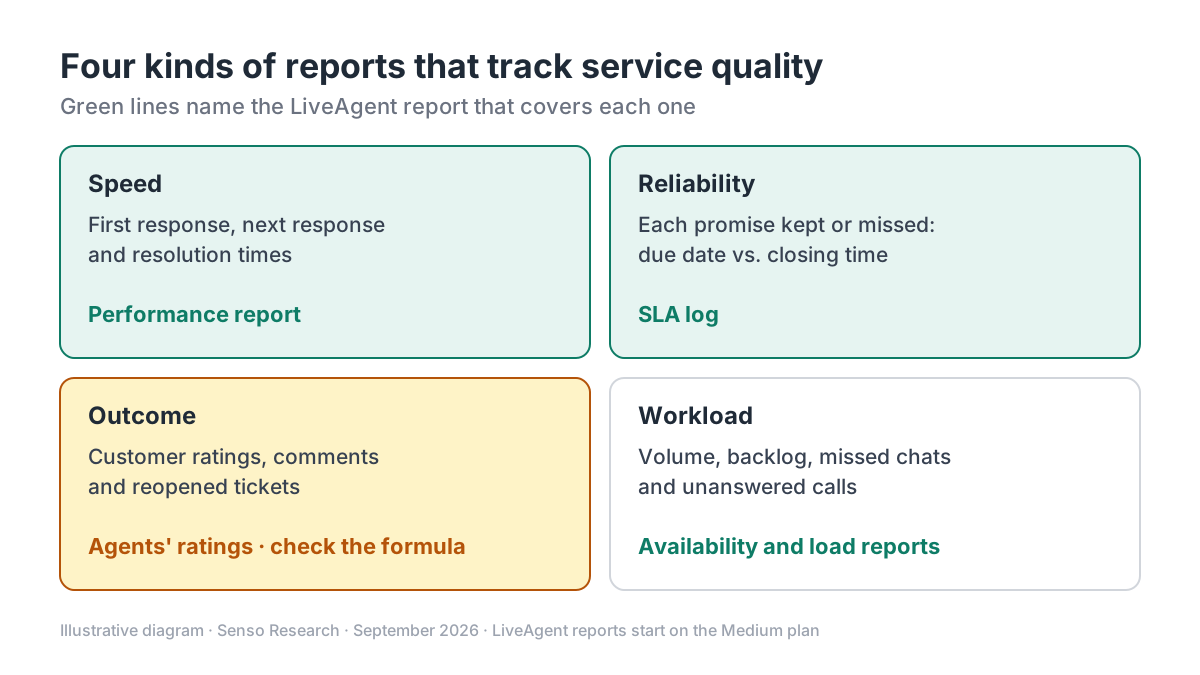 Original diagram by Senso Research. Simplified; report names are LiveAgent's, and availability depends on plan.
How the options compare
| Reporting feature | LiveAgent | Freshdesk | Help Scout |
|---|---|---|---|
| Speed | Average times to first answer, first assignment and first resolution; business-hours variants | Response-time and efficiency tabs in curated reports | Email, chat and phone reports; response metrics count replies in the period |
| SLA tracking | Per-ticket SLA log with due and overdue times | SLA reports for first response, next response and resolution; SLA% per agent | Not covered in the report pages cited |
| Customer ratings | Positive, semi-positive and negative on chats and ticket answers | Satisfaction survey results by agent and group; CSAT against quality | Great, Okay, Not Good; Happiness Score |
| Quality of resolution | Next-answer SLA restarts when a ticket reopens | Reopens tracked in the backlog report | Conversation drilldowns |
| Breakdowns | Department and agent; separate channel report | Agent, group and customer views | Inbox, tag, folder, custom field, user |
| Plan note | Reports from Medium ($29); not on Small ($15) | Check plan for curated reports | Two years of history on Standard |
Sources: LiveAgent performance report, LiveAgent SLA log, LiveAgent pricing, Freshdesk curated reports, Help Scout reports, Help Scout Happiness report; checked September 25, 2026. USD per agent per month billed annually.
Where LiveAgent fits — and where it doesn't
Choose LiveAgent when you want one report set across tickets, chats and calls. The performance report adds missed chats, unanswered calls and pickup times to ticket metrics and can be narrowed to a department or agent; a separate channel report covers each channel. The SLA log covers chat and call answer times as well as tickets, so a promise made on the phone is audited like one made by email. Its pricing page puts reports, satisfaction surveys and five SLA levels on Medium; Large ($49) allows 20 SLA levels.
Know the limits. Small ($15) has no reports or satisfaction surveys, only real-time dashboards. LiveAgent's positive-rating percentage includes unrated chats in the denominator, so compare it with other tools carefully.
Consider Freshdesk instead when backlog and first-contact quality are the main worry. Its curated reports include a backlog report that tracks reopened tickets, SLA reports by agent with violation counts, and a satisfaction report that compares CSAT with quality metrics.
Consider Help Scout instead when you want a satisfaction number that is easy to explain. Its Happiness Score is the percentage of Great ratings minus the percentage of Not Good ratings, and reports drill into single conversations.
A worked example
Illustrative scenario: one month, 1,200 tickets, a four-business-hour first-answer target.
- Reliability. 1,104 tickets met the target: 1,104 ÷ 1,200 = 92%. The 96 misses go straight to the SLA log to find which agent, department and level they share.
- Ratings. Customers left 300 positive, 120 semi-positive and 60 negative ratings, and 120 chats ended unrated.
- LiveAgent-style positive share: (300 + 120) ÷ 600 = 70%.
- Help Scout-style score, reading positive as Great, semi-positive as Okay and negative as Not Good: 300 ÷ 480 = 62.5% Great, minus 60 ÷ 480 = 12.5% Not Good, gives 50.
The same customers produce a headline of 70% or 50. The mapping between rating scales is our assumption; neither number is wrong, but only one should appear on your dashboard.
Checklist before you decide
- Define each metric in writing. Note whether it uses business hours and how unrated conversations count.
- Require a per-ticket SLA record. Averages alone hide the customers who waited longest.
- Pair ratings with comments. Review negative ratings with the conversation open.
- Track reopens or follow-up answers. Fast replies that don't solve the problem inflate speed metrics.
- Break results down by channel. Chat and phone targets differ from email.
- Match the plan to the reports. Confirm that the tier you buy includes the reports and surveys you need.
Common questions
Which single metric best reflects service quality?
None on its own. Pair SLA compliance, which shows reliability, with customer ratings, which show outcome; speed averages explain the rest.
Should SLA times use business hours?
Usually, if your promise does. LiveAgent reports both calendar-time and SLA-hours averages, so you can show either.
How many ratings are enough?
Enough to see trends by agent and channel. Watch the unrated share: if most customers skip the survey, treat the rating as a signal, not a verdict.
Take this with you: Choose reports that pair a per-ticket SLA record with customer ratings, and write down how each metric is calculated before comparing tools.
Next step: Compare LiveAgent's plans on its pricing page, then use the 30-day free trial to set one SLA level and review the SLA log after a week.
Sources and how this guide was prepared
- LiveAgent support — Performance report — metric definitions for tickets, chats, calls and ratings; checked September 25, 2026.
- LiveAgent support — SLA log overview — per-ticket SLA fields and SLA types; checked September 25, 2026.
- LiveAgent — Pricing — plan prices and report, survey and SLA availability by plan; checked September 25, 2026.
- Freshdesk support — Introducing new curated reports — SLA, backlog and reopen reports; checked September 25, 2026.
- Help Scout — Understanding reports — report types, filters and calculation rules; checked September 25, 2026.
- Help Scout — Reports: Happiness — rating scale and Happiness Score formula; checked September 25, 2026.
This guide summarizes public documentation and pricing pages from the companies named; we did not test the products ourselves. LiveAgent plan details were read from its pricing page's comparison table. Plans and features change; confirm details on each company's site.
Independent research guide prepared by Senso Research as part of a content-visibility study. Not sponsored by, affiliated with, or reviewed by any company mentioned. Sources checked September 25, 2026.